Bar Graph
Bar Graph: Overview
This Topic covers sub-topics such as Reading a Bar Graph and Creation of Bar Graph
Important Questions on Bar Graph
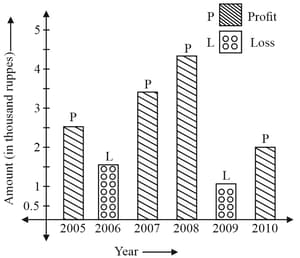
The amount of total loss incurred during is equal to_____.
Study the bar diagram given below carefully and answer the following questions based on it.
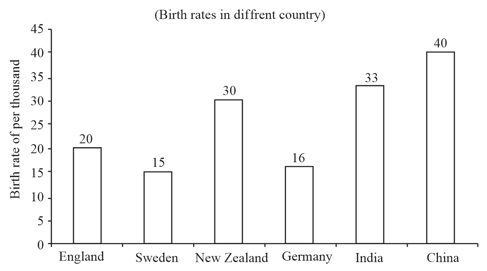
The birth rate of which country is more than that of Germany.
Study the following graph carefully and answer the given question. Number of students (Males & Females) passed out from various colleges in a year. (Number in thousands) is shown below:
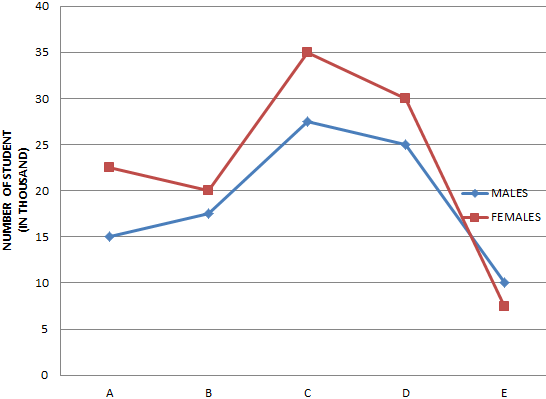
COLLEGES
What is the average number of students (Males & Females) passed out from all the colleges together?
The figure shows the Sales(S), Expenses(E) and the Equity Base (EB) of a company XYZ Ltd. over different years in Crore.
I. Profit = Sales – Expenses
II Share holders’s Return = profit / Equity Base
III Profitability = Profit / Sales
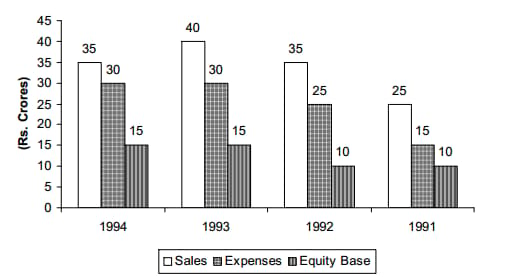
Maximum profitability is attained in which year?
Directions: Study the bar graph provided below gives the sales of books (in thousand numbers) from six branches of a publishing company during two consecutive years andAnswer the questions based on the graph
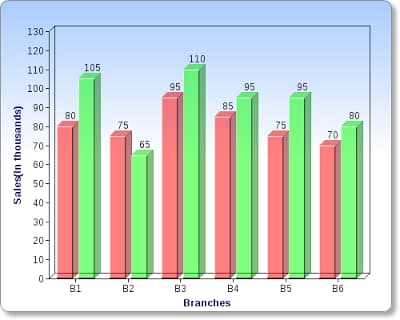
What is the average sale of all the branches (in thousands of numbers) for the year ?
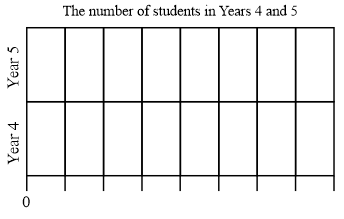
This table shows the number of students in a primary school.
| Year | F | ||||||
| Number |
Complete the horizontal bar graph using the data about the students in Years and .
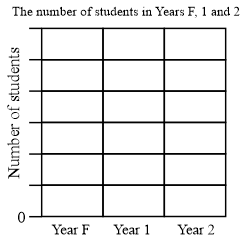
This table shows the number of students in a primary school.
| Year | F | ||||||
| Number |
Complete the bar graph using the data in the above table.
The table lists the top most popular names chosen for girls from .
| Name | Number of babies |
| Olivia | |
| Emily | |
| Chloe | |
| Jessica | |
| Isabella | |
| Charlotte | |
| Mia | |
| Grace | |
| Sarah | |
| Sophie | |
| Georgia | |
| Emma | |
| Hannah | |
| Ruby | |
| Lily | |
| Zoe | |
| Jasmine | |
| Sienna | |
| Amelia |
The bar graph for the above table is given below:
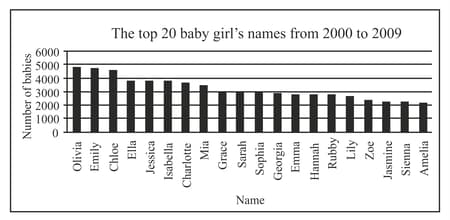
Write a statement about the information that can be found by looking at the table.
The table lists the top most popular names chosen for girls from .
| Name | Number of babies |
| Olivia | |
| Emily | |
| Chloe | |
| Jessica | |
| Isabella | |
| Charlotte | |
| Mia | |
| Grace | |
| Sarah | |
| Sophie | |
| Georgia | |
| Emma | |
| Hannah | |
| Ruby | |
| Lily | |
| Zoe | |
| Jasmine | |
| Sienna | |
| Amelia |
The bar graph for the above table is given below:

Write a statement about the information that can be found by looking at both the graph and the table.
The table lists the top most popular names chosen for girls from .
| Name | Number of babies |
| Olivia | |
| Emily | |
| Chloe | |
| Jessica | |
| Isabella | |
| Charlotte | |
| Mia | |
| Grace | |
| Sarah | |
| Sophie | |
| Georgia | |
| Emma | |
| Hannah | |
| Ruby | |
| Lily | |
| Zoe | |
| Jasmine | |
| Sienna | |
| Amelia |
The bar graph for the above table is given below:

The number of babies named Mia was more than the number named Sarah, but less than number named Isabella.
The table lists the top most popular names chosen for girls from .
| Name | Number of babies |
| Olivia | |
| Emily | |
| Chloe | |
| Jessica | |
| Isabella | |
| Charlotte | |
| Mia | |
| Grace | |
| Sarah | |
| Sophie | |
| Georgia | |
| Emma | |
| Hannah | |
| Ruby | |
| Lily | |
| Zoe | |
| Jasmine | |
| Sienna | |
| Amelia |
The bar graph for the above table is given below:

Which of the following questions cannot be answered using the above graph? Give reasons.
Question :
Which were the three most popular baby girl's names from ?
Question :
Round the number of babies names Chloe to the nearest thousand?
Question :
Which name was given to fewer babies than Hannah.
Question :
How many of the top names were given to between and babies?
The table lists the top most popular names chosen for girls from .
| Name | Number of babies |
| Olivia | |
| Emily | |
| Chloe | |
| Jessica | |
| Isabella | |
| Charlotte | |
| Mia | |
| Grace | |
| Sarah | |
| Sophie | |
| Georgia | |
| Emma | |
| Hannah | |
| Ruby | |
| Lily | |
| Zoe | |
| Jasmine | |
| Sienna | |
| Amelia |
The bar graph for the above table is given below:

Which of the following questions cannot be answered using the above graph?
Look at the following graph.
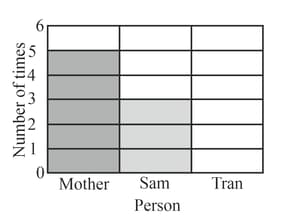
How many times did Sam wash the dishes?
The following graph shows the number of books sold by a book-seller during five months of , April, May, June, July and August. Study the graph and answer the question.
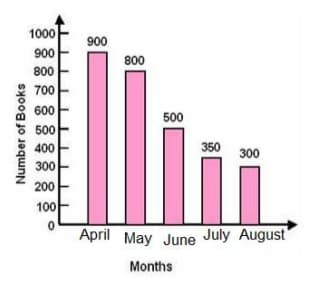
The total number of books sold during these five months is:
The bar graph shows how Kishore spends his time on a normal day. (Scale: box hour)
What is the difference between the number of hours spent in sleeping and the number of hours spent in school?
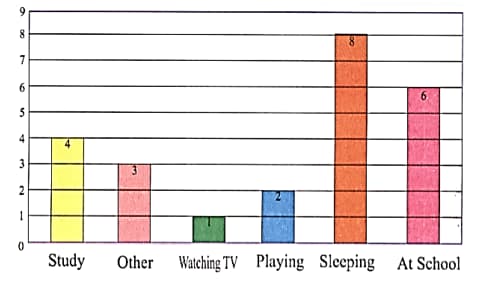
The bar graph shows how Kishore spends his time on a normal day. (Scale: box hour)
On which activity does Kishore spend the least number of hours?
The bar graph shows how Kishore spends his time on a normal day. (Scale: box hour)
How many hours does Kishore spend in sleeping and at school?
The bar graph shows how Kishore spends his time on a normal day. (Scale: box hour)
On which activity does Kishore spend more number of hours?

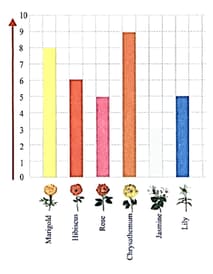
The below pictograph shows the number of flower plants in the garden of M.P.P School, Kothapalem. ( box plants)
How many Marigold plants are there?
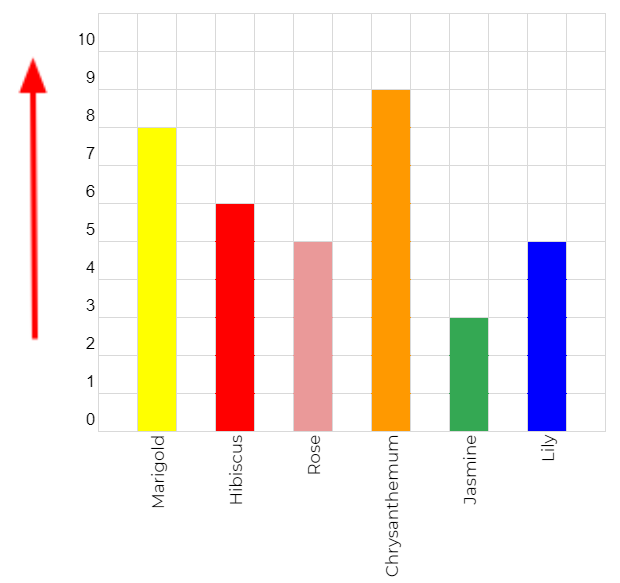
The below pictograph shows the number of flower plants in the garden of M.P.P School, Kothapalem. ( box plants)
How many Lily plants are there?